
Menu Engineering with POS Data: Finding Your Most Profitable Dishes
September 4, 2026
Table Turnover: How to Serve More Covers Without Rushing Guests
September 11, 2026
Most restaurant owners check one number regularly: how much the till took yesterday. It’s the easiest figure to find and the least useful one on its own. Two restaurants can record identical daily revenue and be in completely different financial health, because revenue says nothing about what it cost to earn.
A modern restaurant POS system generates dozens of reports, and the practical problem isn’t access, it’s knowing which handful actually change decisions. Below are the five worth a scheduled hour every week, what each one tells you, and the specific thing to look for in it.
Table of Contents
Why Weekly Beats Daily and Monthly
Daily figures are too noisy to act on. One rainy Tuesday or one large group booking distorts the picture, and reacting to a single day usually means reacting to randomness. Monthly figures have the opposite problem: by the time a month closes, a cost problem has already run for four weeks and the money is gone.
A week is long enough to include every trading pattern the restaurant has, weekday and weekend, lunch and dinner, and short enough that a problem caught on Monday has only cost you seven days rather than thirty.
Report 1: Food Cost Percentage
Food cost percentage is the cost of ingredients used divided by food revenue over the same period. It’s the clearest early warning system a restaurant has, because it moves before profit does and it moves for reasons you can usually identify.

The number itself matters less than the direction it’s moving. A steady figure means your recipes, portions and supplier prices are all behaving. A figure creeping upward two or three weeks running means one of those three has changed, and the useful next step is comparing theoretical cost, what the recipes say you should have used, against actual consumption from your inventory tracking. A widening gap between those two points at over-portioning, waste or theft rather than supplier pricing.
Key takeaway
Never read a single week’s food cost in isolation. The signal is the trend across three or four weeks, because one week’s delivery timing can distort any individual figure.
Report 2: Labour Cost Percentage
Labour cost percentage is total staff cost divided by revenue for the same week. Read at that level it’s a blunt instrument, so the version worth looking at is labour cost broken down by shift or by day rather than as a single weekly figure.
That breakdown answers a more actionable question: which specific shifts are overstaffed relative to what they earn? A Tuesday lunch running the same headcount as a Friday dinner is a scheduling decision, not a fixed cost, and it’s usually invisible in a weekly average because strong shifts mask weak ones.
Report 3: Sales by Daypart
Splitting revenue by time band, breakfast, lunch, afternoon, dinner, late night, shows where the business actually earns and where it merely stays open. Most restaurants discover at least one daypart that consistently fails to cover the staffing it requires.
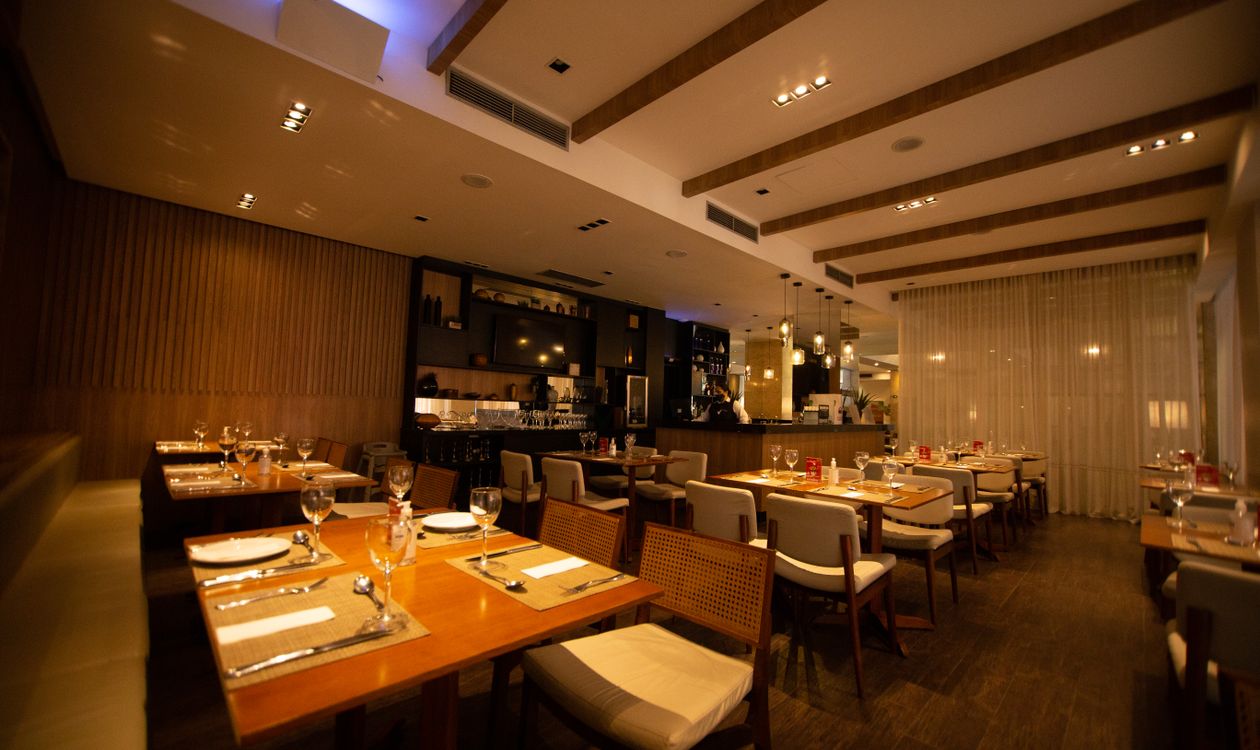
The decisions this unlocks are practical ones: adjusting opening hours, moving staff between shifts, targeting a promotion at the quiet band, or accepting a weak daypart deliberately because it feeds a strong one. In the UAE the pattern is often pronounced, with late dinner service carrying a disproportionate share of the week’s revenue.
Report 4: Voids, Comps and Discounts
This is the report most owners never open, and the one most likely to contain something surprising. Every voided item, comped dish and manual discount is revenue that was recorded and then removed, and the POS logs which staff member authorised each one.
Some of that is legitimate: mistakes happen, dishes get sent back, regulars get looked after. The question is whether the volume is proportionate and whether it’s concentrated. A void rate that’s spread evenly across the team is an operational issue worth fixing with training. A void rate concentrated on one person or one shift is a different conversation entirely.
| Report | What it answers | Look for |
|---|---|---|
| Food cost % | Are ingredients costing more than they should? | Upward drift over 3+ weeks |
| Labour cost % | Which shifts are overstaffed? | Cost per shift, not weekly total |
| Sales by daypart | When does the money actually come in? | Bands that don’t cover staffing |
| Voids & discounts | How much revenue is being removed? | Concentration by staff or shift |
| Spend per cover | Is each guest worth more or less? | Falling average with steady covers |
Can your POS actually produce these five reports?
Tell us what your current system reports on, and we will show you what a weekly review looks like when the numbers are all in one place.
Book a Free DemoReport 5: Average Spend Per Cover
Average spend per cover is total revenue divided by number of guests served. It separates two things that total revenue blends together: how many people came in, and how much each one was worth.
That distinction matters because the two problems have completely different solutions. Falling covers with a steady average is a marketing and footfall problem. Steady covers with a falling average is an operational one, usually meaning starters, desserts or drinks are being ordered less often, or that staff have stopped suggesting them. Watching the two together tells you which lever to pull rather than guessing.
Key takeaway
Total revenue hides more than it reveals. Covers and spend per cover moving in opposite directions is common, and each one points to a completely different fix.
Conclusion
The value in these five reports isn’t in reading them once, it’s in reading the same five every week so you develop a feel for what normal looks like in your restaurant. Once you know your usual food cost range, your typical void level and your standard spend per cover, anything unusual stands out immediately rather than hiding inside a monthly total. That’s the practical difference between a POS that records what happened and an owner who actually knows what’s happening.
Frequently Asked Questions
1. What is a healthy food cost percentage for a restaurant?
It varies widely by concept, so the more useful benchmark is your own historical range rather than an industry figure that may not fit your menu.
2. Should I review these reports myself or delegate them?
Voids and discounts are worth reviewing yourself, since that report exists partly as an internal control and loses value if the person reviewing it is also the person authorising them.
3. Why do my food cost numbers jump around week to week?
Usually delivery timing. A large stock delivery landing inside one week inflates that week and deflates the next, which is why the trend matters more than any single figure.
4. How do I know if my discount levels are too high?
Compare against your own past weeks and check whether discounts are concentrated on particular staff or shifts, which is a stronger signal than the overall percentage.
5. Do these reports work the same for a multi-branch group?
Yes, but review them per branch as well as consolidated, since a group total can hide one location performing significantly worse than the rest.
Want reporting that answers these questions in one place? Explore iTudeTech‘s restaurant POS software or get in touch with our team to see what your weekly review could look like.